
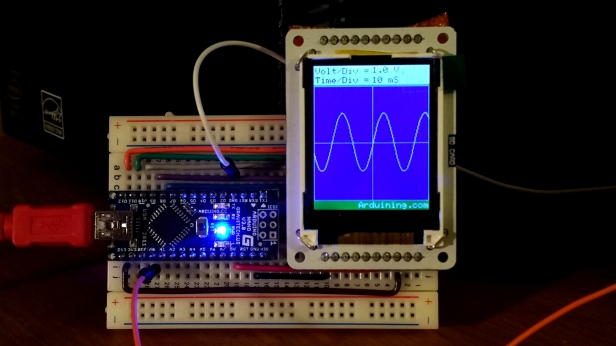
This is a simple plotting example to experiment with the TFT Library and the LCD Display with the ST7735 controller (128×160 pixels).
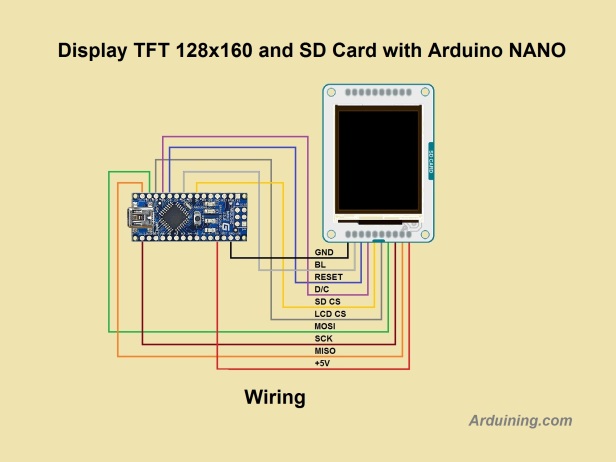
First, a clean wiring diagram to connect the Arduino NANO and the Display. The SD Card adapter was wired (CS and MISO) but not used in this Sketch.
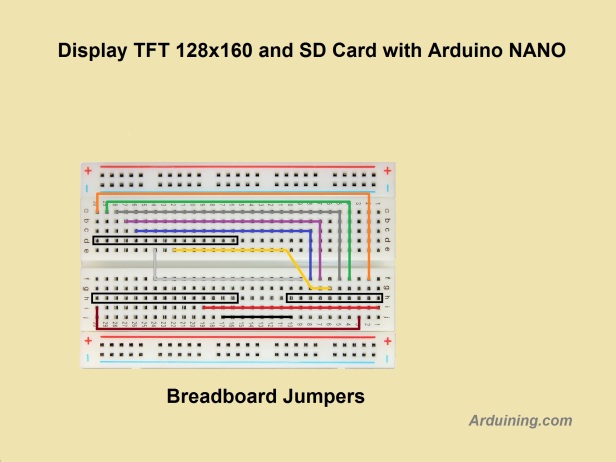
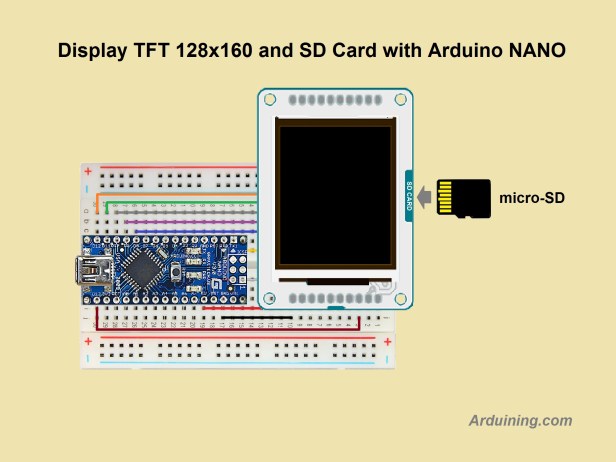
Then, a wiring plan to put them together in the breadboard:
The Sketch:
/*TFT_Grap.ino Arduining 7 AUG 2016
*/

#include <TFT.h>
#include <SPI.h>

//pin definitions:
#define CS 10
#define DC 9
#define RST 8
#define BKLIGHT 6 // Backlight control pin

#define BRIGHTNESS 204 // Backlight intensity (0-255)
#define RANGE 100 // Vertical size of the graph in pixels.
#define WIDTH 128 // Horizontal size of Display in pixels.
#define HEIGHT 160 // Vertical size of Display in pixels.
#define PERSIST 500 // persistence of the graph (milliseconds).

TFT TFTscreen = TFT(CS, DC, RST);

int value ;
int last_value;
int x_pos= 0; // cursor position
int offset= 40; // vertical graph displacement in pixels.

void setup(){
TFTscreen.begin(); // initialize the display
TFTscreen.setRotation(0);
TFTscreen.background(0,128,0); // dark green background
TFTscreen.stroke(255,255,255); // white stroke
analogWrite(BKLIGHT,BRIGHTNESS); //Set brightness.
TFTscreen.setTextSize(1);
TFTscreen.text("Arduining.com",50,151);
drawFrame();
clearGraph();
}

void drawFrame(){
TFTscreen.stroke(255,255,255); // white stroke
TFTscreen.fill( 255, 255, 255 ); // White fill
TFTscreen.rect(0, 0, WIDTH, 21);
TFTscreen.setTextSize(1);
TFTscreen.stroke(0,0,0); // black text
TFTscreen.text("Volts: 1.0V/Div",2,2); // Example text.
TFTscreen.text("Time: 10mS/Div",2,12); // Exanple text
}
void clearGraph(){
TFTscreen.stroke(127,127,127); // grey for the border
TFTscreen.fill( 180, 0, 0 ); // dark Blue for the background
TFTscreen.rect(0, 22, 128, 128);
TFTscreen.line(65, 23, 65, 151); // vertical line
TFTscreen.line(1, 85,127, 85); // horizontal line
TFTscreen.stroke(0,255,255); // yellow stroke for plotting.
}

void plotLine(int last,int actual){
if(x_pos==0)last= actual; // first value is a dot.
TFTscreen.line(x_pos-1, last, x_pos, actual); // draw line.
x_pos++;
if(x_pos > WIDTH){
x_pos=0;
delay(PERSIST);
clearGraph();
}
}

void loop(){
last_value= value;
value= analogRead(A0);
value= map(value,0,1023,149,23);
value -= offset;
if(value <= 23) value= 23; //truncate off screen values.
plotLine(last_value ,value );
delay(10);
}
Thanks for visiting…

when i compile showing error messages like below
please advice me
stray ‘\342’ in program
Error message referred to a stray \342 in the code it is caused by copying the code from a Web page which has Unicode characters in it. Code formatted to avoid the problem.
Hi, I would like to utilize the idea of a graphical screen for an old project of mine. It is called the component curve tracer tester. It needs an oscilloscope equipped with X and Y inputs in order to display the results but it is bulky to use that way. So, I’m thinking if I could create an Arduino simulated oscilloscope with 2 analog inputs (x and Y) so I can connect them to my curve tracer to display the results instead and make the whole thing portable on batteries. Any help, suggestions or links are all much appreciated.
Regards
Hi, nice article and I would like to be able to apply it to my idea of making a component testing curve tracer. Now it would normally use an analog oscilloscope set in the XY mode but it would be a way to bulky and space-hungry to my liking and that’s why an Arduino style 328P MCU made into a miniature oscilloscope (with a color TFT screen and XY inputs capable of withstanding up to 0.1 to 40Vp-p voltages would be a great candidate but have no idea how to do it since my programming skills are quite limited. Any help would be much appreciated TNX